Piney Point, Md., MD Marine Weather | Pinewater
Piney Point, Md., MD
Water temp
––°
F
--
Air temp
––°
F
L:--
H:--
Feels like --°
Wind
--
––
MPH
--
--
––––
––––
––––
––––
––––
––––
Next Tide Predictions
Today
High
--:--
-.-- ft
Low
--:--
-.-- ft
-------
High
--:--
Explore all
Nearby
-.-- ft
Low
--:--
-.-- ft
High
--:--
-.-- ft
Low
--:--
-.-- ft
-------
High
--:--
-.-- ft
Low
--:--
-.-- ft
High
--:--
-.-- ft
Low
--:--
-.-- ft
·
·
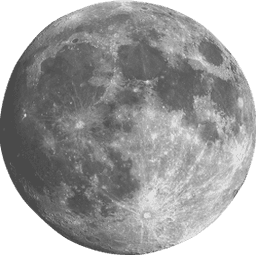
Waning Crescent
Next full
moon
: 19 days
Moonrise: 2:41 AM
Water level
2.62
ft
above MLLW
?
+6
+4
+2
0
-2
+2.62
Air temp
58°
F
L:51
H:64
Feels like 53°
Wind
N
9
MPH
Gentle breeze
20 mph gusts
Wave Height
--
No Data
Humidity
68%
47° dew point
Dry
UV Index
0
Low
Air Pressure
1019mb
Normal
Visibility
15.3 mi
Perfectly clear
Water temp
71°
F
Refreshing
1 Active Notice
Small Craft Advisory
NWS Baltimore MD/Washington DC
Mon 8:54 PM
→
Tue 6:00 AM EDT
Mon 8:54 PM → Tue 6:00 AM EDT
WHAT
North winds 10 to 15 kt with gusts up to 20 kt.
WHERE
Chesapeake Bay and adjoining estuaries north of Smith Point VA, and Tidal Potomac from Cobb Island MD to Smith Point VA.
WHEN
Until 6 AM EDT Tuesday.
IMPACTS
Conditions will be hazardous to small craft.
Recommendations
Inexperienced mariners, especially those operating smaller vessels, should avoid navigating in hazardous conditions.
Falling Tide
Low
tide
in 4hr 44min
0.34 ft · 4:50 am
Next Tide Predictions
Today
Low
4:50 am
0.34 ft
High
11:36 am
1.53 ft
Low
5:06 pm
0.32 ft
High
11:58 pm
1.59 ft
Wednesday
Low
5:44 am
0.27 ft
High
12:32 pm
1.61 ft
Low
6:06 pm
0.24 ft
Thursday
High
12:54 am
1.62 ft
Low
6:35 am
0.21 ft
High
1:22 pm
1.69 ft
Low
7:00 pm
0.17 ft
Friday
High
1:45 am
1.65 ft
Low
7:21 am
0.17 ft
High
2:08 pm
1.74 ft
Low
7:50 pm
0.14 ft
Saturday
High
2:31 am
1.65 ft
Low
8:03 am
0.16 ft
High
2:51 pm
1.77 ft
Low
8:36 pm
0.15 ft
Sunday
High
3:14 am
1.63 ft
Low
8:43 am
0.19 ft
High
3:32 pm
1.77 ft
Low
9:21 pm
0.20 ft
Monday
High
3:57 am
1.58 ft
Low
9:20 am
0.24 ft
High
4:11 pm
1.75 ft
Low
10:05 pm
0.26 ft
How this works
NOAA Predictions
·
Piney Point, Md. tide station (at station)
How this works
Note: The interval shown is High/Low only. The solid orange line is a curve fit between high and low values and approximates the segments between.
Satellite Observations
·
~5mi resolution
Times in Eastern Daylight Time